
Are we in a Bubble, and if so, is it Ready to Pop?
Over the years we have experienced some crazy weeks in financial markets. This week is one right up there with the craziest of them. The big topic with investors and non-investors alike is: ‘Are we are in a financial bubble?’. The craziness surrounding GameStop and other heavily shorted stocks might appear related at first glance, but we view that as a different phenomenon. Let’s get to the Bubble question first. The chart below shows the Google Search Trend for the term ‘Stock Market Bubble’ over the last year. It is quite clear that something changed in January and the bubble became ‘a thing’.

Our perspective at PWM is yes, we are in a bubble, but not in a massive, all-encompassing bubble like the Great Financial Crisis in 2008-09. We suspect this bubble is more like the ‘Tech Wreck’ of the early 2000’s. If you look back at that period, the broad averages were down substantially, but it was really a tale of two markets. The overvalued tech stocks were collapsing, but the value stocks continued to perform well. We see similarities today with tech stocks having massively outperformed value stocks for several years, and although tech has become overvalued, value stocks have not.
On the right side of the chart below, note how the S&P Index, ex-technology, actually rose in 2000, while the tech stocks were in a sharp retreat. We suspect the analogy between then and the current situation may be quite reasonable. This is the key reason why one portion of our equity strategy at PWM is directly allocated to value stocks.
Source: Wall Street Journal
We bring this up because even when markets look like they are reaching a top, we do not believe tops can be predicted accurately or consistently. Secondly, there are often very good reasons to stay invested, even when a top appears to be at hand.
It is precisely for this reason that PWM follows our balanced portfolio approach, both within our equity allocation as well as across the entire portfolio. Warren Buffet famously said “be fearful when others are greedy and greedy when others are fearful”. Last year was an unusual period where we experienced both fear and greed within the same calendar year. Last spring as the pandemic hit, investors were fearful, and we stepped into the market and enjoyed the benefits of the rally. Now the market is greedy, and we see it as a time to be more fearful, but that doesn’t mean we act emotionally when allocating client portfolios. Instead, we stay the disciplined course we have set, keeping risks balanced using our diversified approach.
Why We Think This is a Bubble
Despite some short, but severe interruptions along the way, we have effectively been in a bull market since early 2009. The classic measure of a bear market is a decline of 20%. We find this measure lacking. Some of us at PWM have been around long enough to know a bear market, and it is not measured in percentage terms. A bear market is something that is felt rather than measured. Bear markets are markets that rapidly decline and then begin a long, slow slog back. The Great Depression was a bear market, and it took from 1929 into WWII to get back to even, and the war effort was what probably pulled the US out of depression. Japan is still in a bear market, with the Nikkei Index having peaked in late 1989 at 38,915.87. As this is written, the Nikkei is at 28,635.21. Imagine investing in 1989 and having a negative return for 30+ years!
What has fundamentally changed since 2009 is the willingness of the Federal Reserve and other central banks to inject themselves into markets. They do this in an effort to circumvent these longer corrective phases. If they can’t be avoided, at least they seek to reverse them quickly. This process was actually begun by Alan Greenspan well before 2009, but Ben Bernanke transformed it into an art form in 2009. How did this happen? Without belaboring the point, the deregulation of financial markets has propelled massive innovation in financial markets and most of these innovations involve leverage – the use of borrowed money. That has enabled many, from banks to hedge funds, to over-lever themselves, often putting the broader financial system at risk (the ‘too-big-to-fail’ problem).
We have developed a vast network of derivative products each relying on the viability of counterparties. Counterparty failure can result in a cascading default event, much like dominos falling in a row. The FED and other central banks are charged with keeping the financial system stable, and as credit events happen and threaten that stability, it requires their intervention. Thus, the question as to where the fault lies is really a chicken and egg problem. Government creates the problem and then is also charged with fixing it.
We have now experienced over twenty years of almost continuous FED intervention. The result is that we are now conditioned to the FED’s response. ‘Market-saving’ FED action has become not only predictable, but expected. We have been trained not to worry too much about risk because “the FED will always bail us out”. It is this growing inability to acknowledge or even recognize risk that leads to irrational behavior, that in the end leads to a financial bubble. What follows is what we believe is evidence of that behavior. However, we must also understand that the FED could continue to work its magic for a good while longer and extend the market even higher.
Valuations
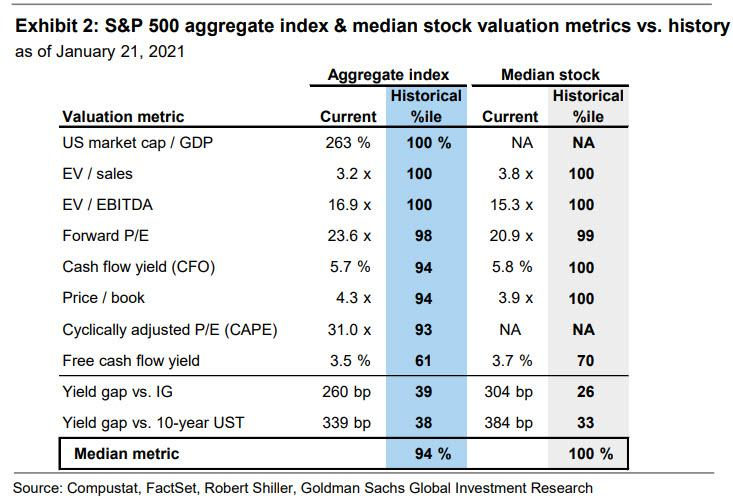
We will be the first to tell you that valuations are not a strong indicator of a bubble about to burst, but market bubbles don’t exist without high valuations. The chart below indicates that using 10 measures of valuation on an aggregate basis, we are in the 94th percentile compared to historical valuations. In other words, valuations have only been higher 6% of the time.
IPOs/SPACs
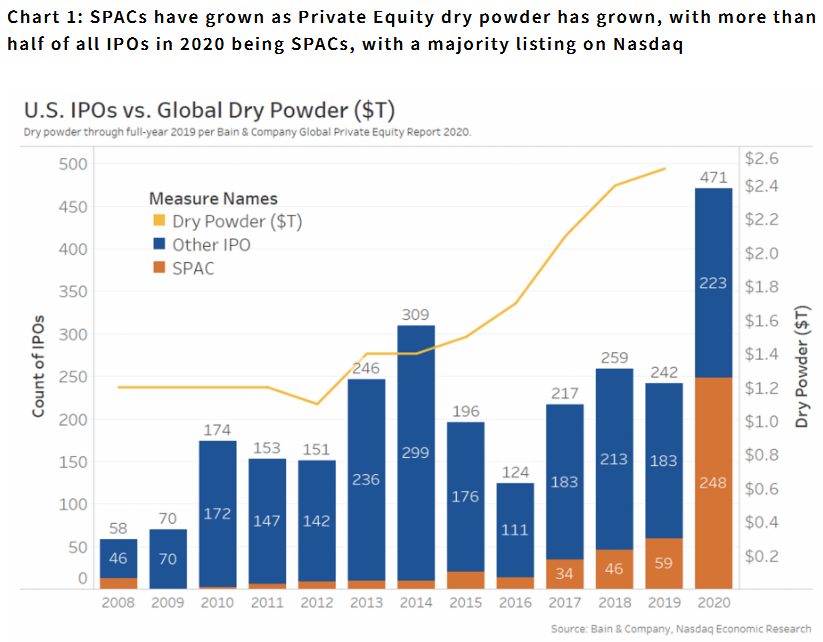
Bubbly markets typically create conditions that are very attractive to companies going public – valuations are high and risk is de-emphasized. As a result, tracking initial public offerings (IPOs) are often an indicator of market excess. IPO activity in 2020 was off the charts. There were 471 IPOs during the year, up 95% from the 242 IPOs in 2019 and 52% from the recent peak of 309 in 2014. More telling is that over half of these IPOs were SPACs. We have discussed SPACs several times, but as a refresher, these are also called ‘blank check’ companies – A SPAC is a shell company with no operations, which goes public with the idea that they will use the money to buy an operating business at some point in the future. While they have been around for years, SPAC’s became very popular in 2019, raising over $1.2 trillion! SPACs are typically formed to acquire private companies, which allows the private company to circumvent the long and expensive IPO process. With technology multiples so much higher in the public market versus the private market, it becomes attractive for the private company as well as the SPAC investor. The result has been large, virtually instant, financial gains when a deal is announced. This has made SPACs one of the hottest tools for companies and investors to take advantage of current conditions. Despite the recent successes, it is important to understand that a SPAC is a pure speculation and, therefore a reasonable indicator of risk appetite.
Call Option Activity
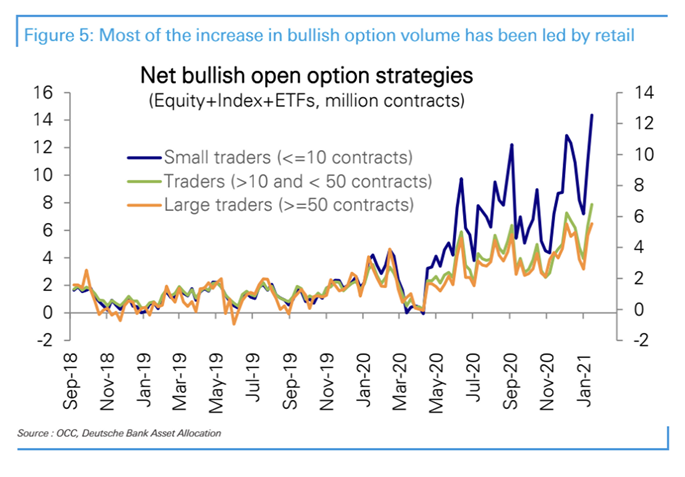
Options are an investment vehicle that can be used in many ways, but the two basic uses are for speculation and hedging. The activity we have seen has been focused on speculation. Over the course of the COVID pandemic, in particular after the stimulus checks were issued, call (bullish) option activity has skyrocketed, especially for small traders. This heavy use of call options, without concurrent increases in put volume, indicates substantially higher levels of bullish speculation than we saw only a few months ago.
Sentiment
Markets continually move between varying degrees of euphoria and panic. As the pandemic hit last February and March, you did not need to be a market guru to know that investor sentiment was very poor and we were leaning toward panic. Likewise, the euphoria of the tech bubble in 1999-00 was palpable. The chart below is the Citi Group Panic-Euphoria Index with the green line demarking the Euphoria threshold and the red line the panic threshold. The recent spike in euphoria has been more than impressive, handily topping the level reached during the tech bubble in 1999-2000.

From our perspective, the body of evidence unequivocally implies is that we are in ‘bubble territory’. There is no rule that any or all of these measures cannot go to further extremes, so this is definitely not an attempt to call the top of the market. Rather it is to define where we are in the current market cycle, and make sure investors’ portfolios are ready for any eventuality, positive or negative.
The inability of PWM (or anyone else for that matter) to accurately and consistently anticipate market tops and bottoms is the core reason for our risk-managed approach to portfolio management. Should markets move higher, we are positioned to participate, and should they move lower, our goal is to be positioned to limit the losses through our strategy of broad diversification. We believe compounding more stable returns is the prudent way to generate wealth over the long term. Limiting losses in poor markets is an important part of that process, and one in which we take an equal amount of pride.
For more on bubbles, we highly recommend the Bloomberg interview of Jeremey Grantham in “What We’re Reading” below. It’s a bit long at 38 minutes, but well worth your time.
GameStop and Other Short (Squeeze) Stories of 2021
Over the last few weeks, we have taken the term “short-squeeze” to a whole new level. As a refresher, being short a stock occurs when you sell a stock that you do not own outright. You borrow the stock to short it, and then sell the borrowed shares. This is done with the expectation that the stock will decline in value so you can buy it back at a lower price (realizing a profit), returning the borrowed shares. This is “selling high and buying low, reversing the old adage “buy low, sell high”. You have simply reversed the order of the transactions.
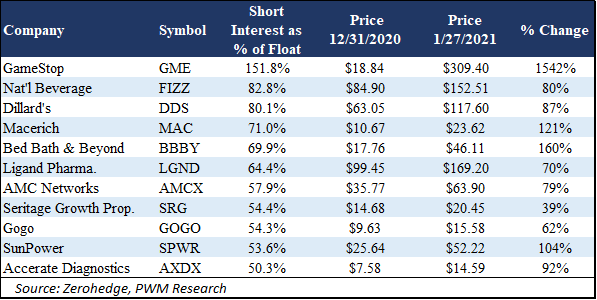
With that in mind, if you examine the chart below, 150% of GameStop floating shares (that is, shares available to trade) have been shorted by investors/speculators. Of course, this should be impossible. You can’t borrow more shares than there are! The reason this has gone above 100% is that there are ‘naked’ shorts. A naked short is one where the stock was sold without being borrowed. Technically, this is not allowed, but loopholes in the law make naked shorting possible. Hedge funds are typically the biggest shorts either as part of a hedged equity strategy or as pure speculation.
What has happened to GameStop and other companies on the list below, is that some smart retail traders and their followers on social media have recognized that a large short position can be an opportunity to ‘squeeze’ the shorts and drive the price higher. While a short squeeze is not uncommon, what we saw this week was unprecedented and we believe it signals a new important entrant into markets – bands of like-minded retail traders attempting to take advantage of market inefficiencies for profit. Historically, hedge funds have not faced much scrutiny in this area, but backed by commission-free trades and some strategic intelligence at the top of the chain, these bands of retail traders are a force to be reckoned with. Several large hedge funds have already announced sizable losses in January.
For those unfamiliar with shorting, let’s look at a quick theoretical example. Hedge Fund ABC shorts 1000 shares of GameStop a year ago at $20 and receives $20,000. A few weeks ago, GameStop was trading at $15, if they had bought the stock to cover the short, it would cost $15,000, leaving a $5,000 profit.
As this is written, GameStop is trading at $325 per share. It would now cost $325,000 to cover the short, creating a loss of $305,000. As the stock moves higher the loss becomes larger and there is no theoretical limit to how high the stock can go, so there is no theoretical limit to the losses that can result. If I buy a stock, my loss is limited. I can’t lose more than what it cost. However, if I short a stock, my potential loss is unlimited. That reality forces shorts to cover those positions (i.e., buy the stock back) when stocks unexpectedly move higher. Of course, buying more of a stock that already moving higher only serves to drive the price higher still, increasing the loss for the short seller – thus creating a ‘short squeeze’. Now, imagine that example with millions, not thousands, of dollars at stake. That is what we are experiencing with GameStop and other stocks on this list and several hedge funds have taken substantial losses as a result.
This will eventually get sorted out and these stocks that have been driven well above any traditional value will come back to earth. When that happens, some of the speculators getting in on the ‘buying’ wagon will likely be left ‘holding the bag’. In the long run, this is not unlike a game of musical chairs. When the music stops, you do not want to be the one without a chair, or in this case, be the one unable to sell the stock at a profit, or even a small loss. This is effectively a zero-sum game. Some will make a lot of money and others will lose it.
More important is the realization that small retail investors (in this case, many armed with stimulus checks from the pandemic) are successfully using social media to effectively pool their money and influence markets in a meaningful way. You can’t put the genie back in the bottle, so for hedge funds, shorting stocks is likely to be a much more difficult game in years to come. Democracy has reached the financial markets, unless regulators decide to put a stop to it. We suspect the market will be hearing from the regulators at some point soon.
In the interim, we at PWM will continue to remain focused on adhering to our longer-term, well-diversified, risk-balanced portfolio strategy, seeking an attractive risk-adjusted return for our investing clients.
What We’re Reading
Why Grantham Says the Next Crash Will Rival 1929, 2000 (38 minute Video)
Working from Home is Losing its Effectiveness, Bank Execs Say
U.S. Consumer Confidence Edges Higher; House Prices Accelerate
NY prosecutor: State ‘Undercounted’ Nursing Home COVID Deaths by Up to 50%
U.S. Population Growth Slows Almost to a Halt
Beyond Reddit, Day Traders Turn Social Media Platforms into Squawk Boxes
Biden Covid Team Derides Trump Plan While Borrowing Playbook
J&J vaccine adds to COVID-19 armoury, includes South African variant
Hedge fund titans Cohen & Sundheim lose big in GameStop short squeeze frenzy
Researchers Looked Into How Recent SPAC Mergers Performed – It’s Not Pretty
Retirement Planning:
How Real Estate Investment Can Boost Retirement
Though real estate comes with its risks and challenges, on the upside, the cost to get started with single-family rentals is relatively low, and your investment will most likely be cash-flow-positive.
Tax Planning:
Strategies For Gifting To Minor Children
An integral function of most estate plans is the transfer of wealth to future generations. But rather than waiting until death to transfer assets, there may be tax benefits to giving while you’re living.
Estate Planning:
33 States with No Estate Taxes or Inheritance Taxes
Even with the federal exemption from death taxes raised, retirees should pay more attention to estate taxes and inheritance taxes levied by states.
Health:
Don’t stress about working out at the best time of day.
Doing exercise is better than not doing exercise, irrespective of timing. However, this study does suggest that afternoon exercise may be more beneficial for people with disrupted metabolisms than the same exercise done earlier.
Disclosures:
Palumbo Wealth Management (PWM) is a registered investment advisor. Advisory services are only offered to clients or prospective clients where PWM and its representatives are properly licensed or exempt from licensure. For additional information, please visit our website at www.palumbowm.com
Past performance may not be indicative of future results. Different types of investments involve varying degrees of risk, and there can be no assurance that the future performance of any specific investment, investment strategy, or product made reference to directly or indirectly in this newsletter, will be profitable, equal any corresponding indicated historical performance level(s), or be suitable for your portfolio.
The information provided is for educational and informational purposes only and does not constitute investment advice and it should not be relied on as such. It should not be considered a solicitation to buy or an offer to sell a security. It does not take into account any investor’s particular investment objectives, strategies, tax status or investment horizon. You should consult your attorney or tax advisor.
The views expressed in this commentary are subject to change based on market and other conditions. These documents may contain certain statements that may be deemed forward‐looking statements. Please note that any such statements are not guarantees of any future performance and actual results or developments may differ materially from those projected. Any projections, market outlooks, or estimates are based upon certain assumptions and should not be construed as indicative of actual events that will occur.
All information has been obtained from sources believed to be reliable, but its accuracy is not guaranteed. There is no representation or warranty as to the current accuracy, reliability or completeness of, nor liability for, decisions based on such information and it should not be relied on as such.
Alan Greenspan, Asset Valuation, Balanced Portfolio, Ben Bernanke, Bubble, Call Options, CitiGroup, Federal Reserve, GameStop, High Valuations, IPOs, Market Sentiment, Panic-Euphoria Index, Portfolio Diversification, Put Options, Short Selling, SPACs, VolumeArticles, General News, Weekly Commentary
By: Adam